Tag: Equities

  • SMB Improves Bottom Line Despite Dip in Revenue

    SMB Improves Bottom Line Despite Dip in Revenue

    Inside Société Multinationale de Bitumes (SMB) Côte d’Ivoire’s activity report for the first quarter of 2024.

    Despite facing a slight dip in revenue due to the conclusion of projects related to the Africa Cup of Nations (AFCON or CAN in French) 2023, the company showed resilience and strong profitability.

    In the following, we dive into SMB’s financial performance and its significance for potential investors.

    Financial Highlights

    Key Financial Metrics:

    Revenue (Chiffre d’affaires):

    • Q1 2024: 70,179
    • Q1 2023: 72,331
    • Change: -3% (2,152)

    Operating Income (Résultat des activités ordinaires):

    • Q1 2024: 4,447
    • Q1 2023: 3,502
    • Change: +27% (945)

    Net Income (Résultat net):

    • Q1 2024: 2,922
    • Q1 2023: 2,553
    • Change: +14.5% (369)

    Key Insights

    Revenue Analysis

    SMB’s revenue for Q1 2024 decreased by 3% compared to Q1 2023, primarily due to the decline in bitumen sales on the national market following the completion of AFCON 2023-related projects.

    However, the export market helped offset this decline, reducing the overall impact on revenue.

    Profitability

    Despite the drop in revenue, SMB achieved an impressive 27% increase in operating income, reaching 4,447 million FCFA.

    This significant growth is attributed to a more favorable economic context for refining, with a margin indicator of $5.96 per barrel compared to $2.37 per barrel in Q1 2023.

    Net income also rose by 14.5%, reaching 2,922 million FCFA. This growth reflects effective cost management and improved profitability in the face of challenging market conditions.

    Strategic Outlook for SMB

    Market Dynamics

    The national demand for bitumen decreased in Q1 2024 due to the completion of AFCON 2023 projects. However, the implementation of the government’s road program as part of the National Development Plan (PND) 2020-2025 is expected to drive demand growth in the upcoming quarters.

    Operational Efficiency

    The favorable refining margins have significantly boosted SMB’s gross margin and overall profitability. The company’s ability to capitalize on export opportunities has mitigated the impact of reduced national sales.

    Future Prospects

    SMB remains well-positioned to benefit from the anticipated increase in national bitumen demand as the government’s infrastructure projects gain momentum. The focus on operational efficiency and strategic market expansion will support sustained growth.

    SMB CI Stock Performance

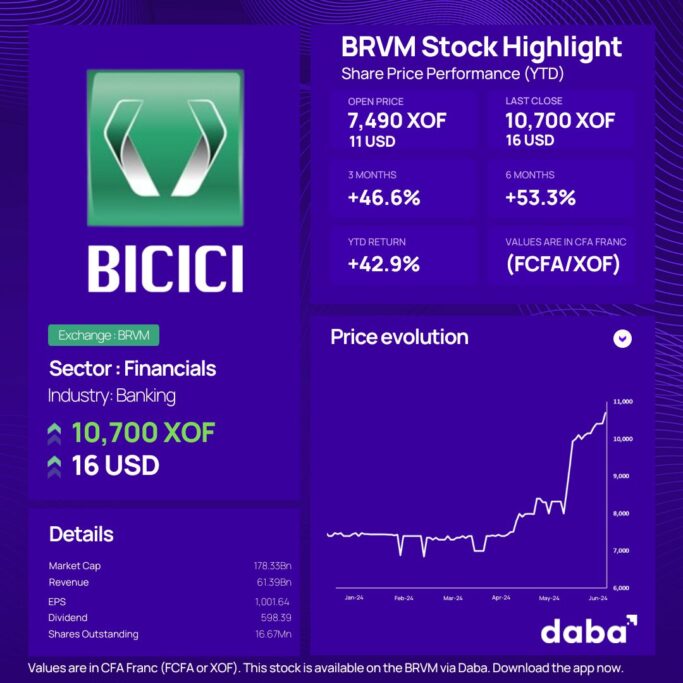
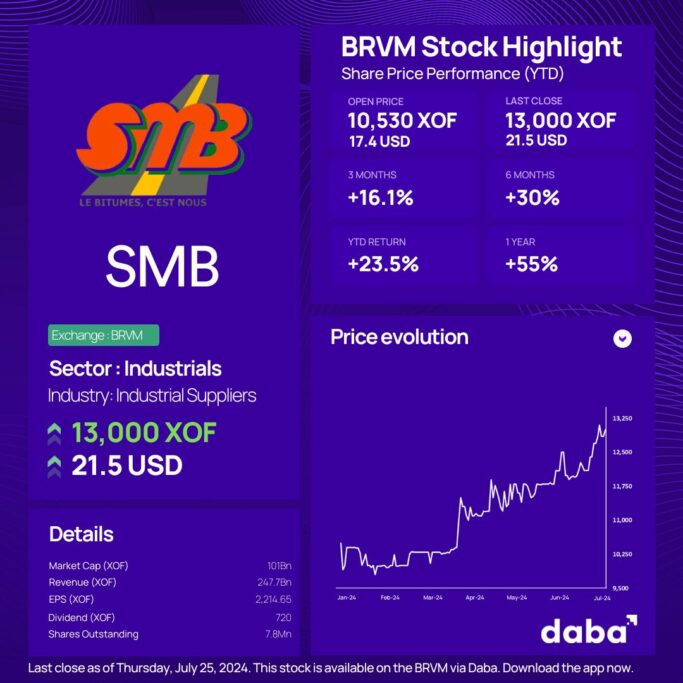
    SMB Côte d’Ivoire is currently the 21st most valuable stock on the BRVM with a market capitalization of XOF 100 billion, which is about 1.13% of the stock market.

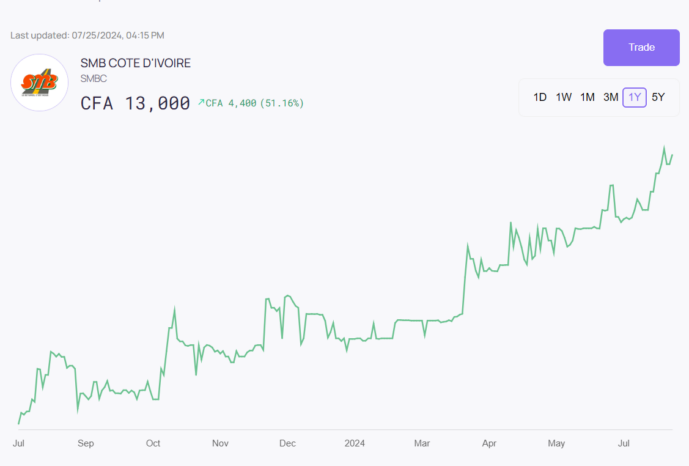
    SMB began the year with a share price of 10,530 XOF and has since gained 22% on that price valuation, ranking it ninth on the BRVM in terms of year-to-date performance.

    Important to note that the stock has accrued 7% over the past four-week period, the seventh best over that period.

    What This Means For Investors

    SMB’s performance in Q1 2024 highlights the resilience and potential of the bitumen industry in Côte d’Ivoire. The company’s ability to achieve strong profitability despite revenue challenges underscores its robust operational framework and strategic acumen.

    For potential investors, SMB presents a compelling investment opportunity. The company’s solid financial performance, effective cost management, and strategic focus on market expansion make it an attractive option for those looking to invest in the African construction and infrastructure sector.

    Investors can easily buy and trade BRVM stocks like SMB using the Daba mobile platform. It offers a convenient way to invest in high-performing stocks on the BRVM, providing access to dynamic and rapidly growing markets.


    With Daba Pro, our investors spot opportunities in stocks like this before they rally, ensuring they stay ahead of the market and make informed investment decisions. Tap here to subscribe now.


    Conclusion

    SMB’s Q1 2024 report reflects strong financial health with significant growth in operating and net income. The company’s effective cost management and strategic focus on enhancing refining margins and capitalizing on export opportunities position it well for continued success.

    For investors, the company’s impressive stock performance and strategic initiatives highlight its potential for long-term growth and profitability.

    Platforms like Daba offer a convenient way to invest in SMB and other high-performing BRVM stocks, providing access to promising investment opportunities in Africa’s dynamic markets.

    Embrace the future of Africa’s economic growth and explore the myriad investment opportunities available in this resilient and promising continent with Daba.

  • Ordre au marché vs ordre à cours limité : connaître la différence et savoir quand les utiliser

    Ordre au marché vs ordre à cours limité : connaître la différence et savoir quand les utiliser

    Les ordres au marché offrent rapidité et simplicité tandis que les ordres à cours limité offrent contrôle et protection. De nombreux investisseurs utilisent les deux pour optimiser leurs stratégies de trading.


    Investir dans les actions peut être un excellent moyen de constituer une richesse au fil du temps. Cependant, comprendre la mécanique de la passation des ordres est crucial pour réussir ses investissements.

    Deux types courants d’ordres utilisés par les investisseurs sont les ordres au marché et les ordres à cours limité. Ce blog expliquera les différences entre ces types d’ordres, leurs avantages et inconvénients, et quand les utiliser.

    Comprendre les ordres au marché

    Un ordre au marché est le type d’ordre le plus simple. Lorsque vous passez un ordre au marché, vous demandez à votre courtier d’acheter ou de vendre une action immédiatement au meilleur prix disponible. Les ordres au marché sont exécutés rapidement, ce qui est leur principal avantage.

    Par exemple, si vous souhaitez acheter des actions d’une entreprise et que vous passez un ordre au marché, votre transaction sera exécutée au prix du marché actuel. Cela signifie que si l’action se négocie à 50 $ par action, vous l’achèterez à ce prix ou très proche de celui-ci.

    Avantages des ordres au marché :

    Rapidité : Les ordres au marché sont exécutés presque instantanément.

    Simplicité : Ils sont faciles à passer et ne nécessitent pas de fixer un prix spécifique.

    Inconvénients des ordres au marché :

    Incertitude sur le prix : Le prix final d’exécution peut différer du dernier prix négocié, surtout sur les marchés volatils.

    Coûts plus élevés : Sur des marchés en mouvement rapide, vous pourriez payer plus que prévu pour un ordre d’achat ou vendre pour moins que prévu pour un ordre de vente.

    Lire aussi : Comment choisir une action : un guide pour les débutants

    Comprendre les ordres à cours limité

    Un ordre à cours limité vous permet de spécifier le prix auquel vous souhaitez acheter ou vendre une action.

    Pour un ordre d’achat à cours limité, vous fixez le prix maximum que vous êtes prêt à payer, et l’ordre ne sera exécuté que si le prix de l’action tombe à ce niveau ou en dessous. Pour un ordre de vente à cours limité, vous fixez le prix minimum que vous êtes prêt à accepter, et l’ordre ne sera exécuté que si le prix de l’action atteint ce niveau ou au-dessus.

    Par exemple, si vous souhaitez acheter des actions d’une entreprise mais que vous estimez que le prix actuel de 50 $ est trop élevé, vous pouvez passer un ordre d’achat à cours limité à 45 $. La transaction ne sera exécutée que si le prix de l’action baisse à 45 $ ou moins.

    Avantages des ordres à cours limité :

    Contrôle du prix : Vous avez le contrôle sur le prix auquel votre ordre est exécuté.

    Protection : Les ordres à cours limité peuvent vous protéger contre l’achat à un prix trop élevé ou la vente à un prix trop bas.

    Inconvénients des ordres à cours limité :

    Incertitude d’exécution : Il n’y a aucune garantie que l’ordre sera exécuté si l’action n’atteint pas le prix que vous avez spécifié.

    Complexité : Les ordres à cours limité nécessitent plus d’attention et une compréhension des conditions du marché.

    Quand utiliser les ordres au marché

    Les ordres au marché sont les mieux utilisés lorsque :

    La rapidité est essentielle : Vous devez exécuter une transaction rapidement, et le prix exact est moins important.

    Actions très liquides : L’action est très liquide avec des écarts serrés entre l’offre et la demande, ce qui signifie que la différence de prix entre l’achat et la vente est minime.

    Décisions de trading urgentes : Vous souhaitez entrer ou sortir d’une position immédiatement sans vous soucier des légères variations de prix.

    Par exemple, si vous utilisez l’application Daba pour investir dans des actions africaines, et que vous voyez une opportunité soudaine ou que vous devez vendre rapidement en raison des nouvelles du marché, un ordre au marché peut vous aider à agir rapidement.

    Lire aussi : Qu’est-ce qu’un indice ? Un guide pour les débutants sur les marchés boursiers

    Quand utiliser les ordres à cours limité

    Les ordres à cours limité sont les mieux utilisés lorsque :

    Le contrôle des prix est crucial : Vous souhaitez acheter ou vendre à un prix spécifique ou meilleur.

    Marchés volatils : L’action est volatile, et vous voulez éviter d’acheter à un pic ou de vendre à un creux.

    Actions peu liquides : L’action est moins liquide, et vous voulez garantir un prix équitable pour votre transaction.

    Sur Daba, par exemple, vous pourriez trouver une entreprise prometteuse cotée à la BRVM. Si vous estimez que le prix actuel est trop élevé mais anticipez une baisse, passer un ordre à cours limité vous assure d’acheter uniquement au prix que vous jugez acceptable.

    Combiner les ordres pour un trading efficace

    De nombreux investisseurs expérimentés utilisent une combinaison d’ordres au marché et d’ordres à cours limité pour optimiser leurs stratégies de trading.

    Par exemple, ils peuvent passer un ordre à cours limité pour acheter une action à un prix plus bas tout en définissant un ordre au marché pour vendre si l’action atteint un certain prix élevé rapidement.

    Daba Pro offre des outils de trading avancés et des analyses, vous aidant à décider quand utiliser les ordres au marché par rapport aux ordres à cours limité. Avec Daba Pro, vous pouvez accéder à des analyses de marché détaillées et des conseils d’experts pour affiner votre stratégie de trading, vous assurant de prendre des décisions éclairées.

    Conseils pratiques pour utiliser les ordres au marché et à cours limité

    Surveillez les conditions du marché : Gardez un œil sur les tendances du marché et les nouvelles susceptibles d’affecter les prix des actions.

    Fixez des prix réalistes : Lors du passage d’ordres à cours limité, fixez des prix qui reflètent les conditions du marché et des attentes réalistes.

    Révisez vos ordres : Examinez et ajustez régulièrement vos ordres si nécessaire pour répondre aux conditions changeantes du marché.

    Avec Daba, vous pouvez facilement suivre les tendances du marché, examiner votre portefeuille et ajuster vos ordres. L’interface conviviale de la plateforme vous permet de rester informé et de contrôler vos investissements.

    Conclusion

    Comprendre les différences entre les ordres au marché et les ordres à cours limité est essentiel pour tout investisseur. Les ordres au marché offrent rapidité et simplicité, ce qui les rend idéaux pour les transactions rapides sur les marchés liquides. Les ordres à cours limité offrent contrôle et protection, les rendant adaptés aux marchés volatils ou peu liquides.

    Que vous soyez un investisseur chevronné ou nouveau dans le monde de l’investissement, l’application Daba offre les outils et services dont vous avez besoin pour prendre des décisions éclairées. Des données de marché en temps réel aux analyses d’experts avec Daba Pro, notre plateforme est conçue pour vous aider à naviguer dans le monde complexe et dynamique de l’investissement dans les actions africaines avec confiance et clarté.

    Téléchargez l’application Daba aujourd’hui pour améliorer vos stratégies de trading et tirer le meilleur parti de vos investissements.

  • Market Order v Limit Order: Know The Difference & When to Use Them

    Market Order v Limit Order: Know The Difference & When to Use Them

    Market orders provide speed and simplicity while limit orders offer control and protection. Many investors use both to optimize their trading strategies.


    Investing in stocks can be an excellent way to build wealth over time. However, understanding the mechanics of placing trades is crucial for successful investing.

    Two common types of orders investors use are market orders and limit orders. This blog will explain the differences between these order types, their advantages and disadvantages, and when to use them.

    Understanding Market Orders

    A market order is the most straightforward type of order. When you place a market order, you instruct your broker to buy or sell a stock immediately at the best available current price. Market orders are executed quickly, which is their primary advantage.

    For example, if you want to buy shares of a company and you place a market order, your trade will be executed at the current market price. This means if the stock is trading at $50 per share, you will buy it at that price or very close to it.

    Advantages of Market Orders:

    Speed: Market orders are executed almost instantly.

    Simplicity: They are easy to place and don’t require setting a specific price.

    Disadvantages of Market Orders:

    Price Uncertainty: The final execution price may differ from the last traded price, especially in volatile markets.

    Higher Costs: In fast-moving markets, you might end up paying more than anticipated for a buy order or selling for less than anticipated for a sell order.

    Also Read: How to Pick a Stock: A Guide For Beginners

    Understanding Limit Orders

    A limit order allows you to specify the price at which you want to buy or sell a stock.

    For a buy limit order, you set the maximum price you are willing to pay, and the order will only execute if the stock’s price falls to or below that level. For a sell limit order, you set the minimum price you are willing to accept, and the order will execute only if the stock’s price rises to or above that level.

    For example, if you want to buy shares of a company but believe the current price of $50 is too high, you can place a buy limit order at $45. The trade will only execute if the stock price drops to $45 or lower.

    Advantages of Limit Orders:

    Price Control: You have control over the price at which your order is executed.

    Protection: Limit orders can protect you from buying at too high a price or selling at too low a price.

    Disadvantages of Limit Orders:

    Execution Uncertainty: There’s no guarantee that the order will be executed if the stock doesn’t reach your specified price.

    Complexity: Limit orders require more attention and understanding of the market conditions.

    When to Use Market Orders

    Market orders are best used when:

    Speed is essential: You need to execute a trade quickly, and the exact price is less important.

    Highly Liquid Stocks: The stock is highly liquid with tight bid-ask spreads, meaning the price difference between buying and selling is minimal.

    Urgent Trading Decisions: You want to enter or exit a position immediately without concern for slight price variations.

    For instance, if you’re using the Daba app to invest in African stocks, and you see a sudden opportunity or need to sell quickly due to market news, a market order can help you act swiftly.

    Also Read: What is an Index? A Beginner’s Guide to Stock Markets

    When to Use Limit Orders

    Limit orders are best used when:

    Price Control is Crucial: You want to buy or sell at a specific price or better.

    Volatile Markets: The stock is volatile, and you want to avoid buying at a peak or selling at a trough.

    Illiquid Stocks: The stock is less liquid, and you want to ensure a fair price for your trade.

    On Daba for instance, you might find a promising company listed on the BRVM exchange. If you believe the current price is too high but anticipate a drop, placing a limit order ensures you only buy at the price you’re comfortable with.

    Combining Orders for Effective Trading

    Many experienced investors use a combination of market and limit orders to optimize their trading strategies.

    For example, they might place a limit order to buy a stock at a lower price while setting a market order to sell if the stock reaches a certain high price quickly.

    Daba Pro offers advanced trading tools and insights, helping you decide when to use market orders versus limit orders. With Daba Pro, you can access detailed market analysis and expert advice to refine your trading strategy, ensuring you make well-informed decisions.

    Practical Tips for Using Market and Limit Orders

    Monitor Market Conditions: Keep an eye on market trends and news that could affect stock prices.

    Set Realistic Prices: When placing limit orders, set prices that reflect market conditions and realistic expectations.

    Review Your Orders: Regularly review and adjust your orders as needed to respond to changing market conditions.

    With Daba, you can easily track market trends, review your portfolio, and adjust your orders. The platform’s user-friendly interface ensures you stay informed and in control of your investments.

    Conclusion

    Understanding the differences between market orders and limit orders is essential for any investor. Market orders provide speed and simplicity, making them ideal for quick trades in liquid markets. Limit orders offer control and protection, making them suitable for volatile or illiquid markets.

    Whether you’re a seasoned investor or new to the world of investing, the Daba app offers the tools and services you need to make informed decisions. From real-time market data to expert insights with Daba Pro, our platform is designed to help you navigate the complex and dynamic world of investing in African stocks with confidence and clarity.

    Get the Daba app today to enhance your trading strategies and make the most of your investments.

  • BICICI au 1er trimestre 2024 : Avantages pour les investisseurs du secteur bancaire

    BICICI au 1er trimestre 2024 : Avantages pour les investisseurs du secteur bancaire

    Investir dans le secteur bancaire offre de nombreux avantages, comme le montre la performance financière impressionnante de BICICI (Banque Internationale pour le Commerce et l’Industrie de la Côte d’Ivoire) au premier trimestre 2024.

    Malgré les défis économiques mondiaux, le secteur bancaire démontre une résilience et un potentiel de croissance robuste.

    Voici les principaux avantages d’investir dans le secteur bancaire, basés sur le rapport financier du 1er trimestre 2024 de BICICI.

    1. Croissance financière solide

    • Croissance du Produit Net Bancaire (PNB) :

    BICICI, cotée à la BRVM, a vu son PNB augmenter de 38,2%, passant de 12 milliards FCFA au 1er trimestre 2023 à 16,6 milliards FCFA au 1er trimestre 2024. Cette augmentation significative souligne la capacité de la banque à générer des revenus plus élevés à partir de ses opérations principales, indiquant une santé financière et une rentabilité solides.

    • Augmentation substantielle du Résultat Brut d’Exploitation avant impôt :

    Le résultat brut d’exploitation avant impôt de la banque a augmenté de manière impressionnante de 276,6%, atteignant 7 514 millions FCFA au 1er trimestre 2024, contre 1 995 millions FCFA au 1er trimestre 2023. Cette croissance remarquable souligne une gestion efficace des coûts et une efficacité opérationnelle.

    • Forte croissance du bénéfice net :

    Le bénéfice net de BICICI a augmenté de 244,2%, passant de 1 892 millions FCFA au 1er trimestre 2023 à 6 512 millions FCFA au 1er trimestre 2024. Cette augmentation substantielle de la rentabilité améliore la valeur pour les actionnaires et indique un fort retour sur investissement.

    2. Expansion du portefeuille de prêts

    • Augmentation des prêts nets aux clients :

    La croissance de 5,2% des prêts nets aux clients, passant de 463 969 millions FCFA en mars 2023 à 488 237 millions FCFA en mars 2024, reflète la capacité de la banque à développer ses opérations de prêt.

    Cette croissance indique une forte demande de crédit et une gestion efficace des risques, essentielle pour une croissance durable du secteur bancaire.

    3. Résilience face aux défis économiques

    • Adaptabilité aux conditions économiques mondiales :

    Malgré les défis économiques mondiaux, notamment les répercussions de la guerre en Ukraine, le resserrement des politiques monétaires et l’inflation persistante, BICICI a démontré sa résilience.

    La capacité de la banque à surmonter ces défis et à réaliser une croissance substantielle souligne la stabilité et la robustesse du secteur bancaire.

    4. Perspectives d’avenir positives

    • Poursuite attendue des tendances de croissance :

    En se basant sur les dynamiques commerciales actuelles, BICICI devrait maintenir sa tendance positive au deuxième trimestre 2024.

    L’amélioration attendue des rendements sur le capital et les investissements de portefeuille, combinée à un contrôle efficace des coûts et à une gestion des risques, positionne la banque pour une croissance et une rentabilité continues.

    Performance boursière de BICICI

    Parallèlement à sa performance financière impressionnante, BICICI a vu son cours de bourse augmenter de manière spectaculaire de 46,6% au cours des trois derniers mois.

    Commençant à 7 490 XOF (11 USD), l’action a grimpé à 10 700 XOF (16 USD), offrant un rendement depuis le début de l’année de 42,9% au vendredi 21 juin 2024.

    Cette croissance remarquable reflète la performance robuste et les avancées stratégiques dans l’industrie bancaire ouest-africaine francophone. Les investisseurs voient des rendements substantiels, et la dynamique ne montre aucun signe de ralentissement.

    Lire aussi : La banque ivoirienne BICI augmente son bénéfice de 35% à 27 millions de dollars en 2023

    Conclusion

    Investir dans le secteur bancaire offre de nombreux avantages, comme en témoigne la performance financière de BICICI au 1er trimestre 2024. La forte croissance financière, l’expansion du portefeuille de prêts, la résilience face aux défis économiques et les perspectives d’avenir positives font du secteur bancaire une opportunité d’investissement attrayante.

    Les résultats impressionnants de BICICI soulignent le potentiel de rendements substantiels et de création de valeur à long terme, faisant du secteur bancaire un choix judicieux pour les investisseurs recherchant stabilité et croissance.

    En tirant parti des atouts démontrés par BICICI, les investisseurs peuvent capitaliser sur la performance robuste et la résilience du secteur bancaire, assurant ainsi un investissement rentable et sécurisé.

    Vous voulez rester en avance sur la courbe et découvrir d’autres opportunités d’investissement à fort potentiel comme celle-ci ? Téléchargez l’application Daba maintenant et accédez aux meilleures analyses et outils d’investissement.

    ***1 USD = 680 XOF au vendredi 21 juin 2024.

  • BICICI in Q1 2024: Positives for Banking Sector Investors

    BICICI in Q1 2024: Positives for Banking Sector Investors

    Investing in the banking industry offers numerous advantages, as highlighted by BICICI’s (Banque Internationale pour le Commerce et l’Industrie de la Côte d’Ivoire) impressive financial performance in the first quarter of 2024.

    Despite global economic challenges, the banking sector demonstrates resilience and robust growth potential.

    Here are the key positives for investing in the banking industry based on BICICI’s Q1 2024 financial report.

    1. Strong Financial Growth

    Net Banking Income (NBI) Growth:

    BRVM-listed BICICI saw its NBI surge by 38.2%, from 12 billion FCFA in Q1 2023 to 16.6 billion FCFA in Q1 2024. This significant increase highlights the bank’s ability to generate higher income from its core operations, indicating strong financial health and profitability.

    Substantial Increase in Operating Income Before Tax:

    The bank’s operating income before tax grew by an impressive 276.6%, reaching 7,514 million FCFA in Q1 2024, up from 1,995 million FCFA in Q1 2023. This remarkable growth underscores effective cost management and operational efficiency.

    Robust Growth in Net Profit:

    BICICI’s net profit rose by 244.2%, from 1,892 million FCFA in Q1 2023 to 6,512 million FCFA in Q1 2024. This substantial increase in profitability enhances shareholder value and indicates a strong return on investment.

    2. Expanding Loan Portfolio

    Increase in Net Loans to Customers:

    The 5.2% growth in net loans to customers, from 463,969 million FCFA in March 2023 to 488,237 million FCFA in March 2024, reflects the bank’s ability to expand its lending operations.

    This growth indicates a strong demand for credit and effective risk management, essential for sustainable growth in the banking sector.

    3. Resilience Amid Economic Challenges

    Adaptability to Global Economic Conditions:

    Despite the global economic challenges, including the repercussions of the war in Ukraine, tightening monetary policies, and persistent inflation, BICICI demonstrated resilience.

    The bank’s ability to navigate these challenges and achieve substantial growth underscores the stability and robustness of the banking sector.

    4. Positive Future Outlook

    Expected Continuation of Growth Trends:

    Based on the current commercial dynamics, BICICI is expected to maintain its positive trend into the second quarter of 2024.

    The anticipated improvement in returns on capital and portfolio investments, combined with effective cost control and risk management, positions the bank for continued growth and profitability.

    BICICI Stock Performance

    In tandem with its impressive financial performance, BICICI has seen its share price skyrocket by an impressive 46.6% over the past three months.

    Starting at 7,490 XOF (11 USD), the stock has climbed to 10,700 XOF (16 USD), delivering a year-to-date return of 42.9% as of Friday, June 21, 2024.

    This remarkable growth reflects the robust performance and strategic advancements in the francophone West African banking industry. Investors are seeing substantial returns, and the momentum shows no signs of slowing down.

    Also Read: Ivorian bank BICI grows profit by 35% to $27m in 2023

    Conclusion

    Investing in the banking industry offers numerous benefits, as evidenced by BICICI’s Q1 2024 financial performance. The strong financial growth, expanding loan portfolio, resilience amid economic challenges, and positive future outlook make the banking sector an attractive investment opportunity.

    BICICI’s impressive results highlight the potential for substantial returns and long-term value creation, making the banking industry a smart choice for investors seeking stability and growth.

    By leveraging the strengths demonstrated by BICICI, investors can capitalize on the robust performance and resilience of the banking sector, ensuring a profitable and secure investment.

    Want to stay ahead of the curve and discover more high-potential investment opportunities like this? Download the Daba app now and unlock access to the best investment insights and tools.

    ***1 USD = 680 XOF as of Friday June 21, 2024.

  • Investir dans l’Industrie des Télécommunications : Insights du Rapport Q1 2024 de Sonatel

    Investir dans l’Industrie des Télécommunications : Insights du Rapport Q1 2024 de Sonatel

    L’industrie des télécommunications en Afrique de l’Ouest francophone évolue rapidement, offrant de nombreuses opportunités aux investisseurs.

    Avec ses actions cotées à la Bourse Régionale des Valeurs Mobilières (BRVM), le rapport financier Q1 2024 (janvier à mars) du Groupe Sonatel met en lumière plusieurs raisons convaincantes pour considérer ce secteur.

    Voici un examen détaillé des principaux points positifs qui font de l’investissement dans l’industrie des télécommunications un choix judicieux.

    Forte Croissance Financière

    Croissance du Chiffre d’Affaires : Sonatel a rapporté une augmentation de 10,6% de ses revenus, reflétant une forte demande pour les services de télécommunications. Cela indique un marché sain et des stratégies robustes d’acquisition de clients.

    Croissance de l’EBITDA : L’EBITDA de l’entreprise a augmenté de 16,7%, démontrant une rentabilité améliorée et une efficacité opérationnelle accrue. Cela montre clairement que Sonatel gère efficacement ses coûts tout en améliorant ses flux de revenus.

    Amélioration du Résultat Net : Avec une augmentation de 22,1% du résultat net, Sonatel affiche une forte croissance du résultat net. Cette amélioration souligne la capacité de l’entreprise à optimiser ses revenus et à maîtriser ses dépenses.

    Expansion de la Base Clientèle

    Clients Mobiles : La base de clients mobiles de Sonatel a augmenté pour atteindre 40,7 millions, soit une augmentation de 6,2% par rapport à l’année précédente. Cette croissance souligne la demande croissante pour les services mobiles et la pénétration efficace du marché par l’entreprise.

    Utilisateurs 4G : On a observé une augmentation significative de 29,9% des utilisateurs actifs de la 4G, reflétant l’adoption réussie des technologies mobiles avancées. Cela positionne Sonatel comme un leader dans la fourniture de services Internet mobiles haute vitesse.

    Large Bande Fixe et Fibre : Sonatel a enregistré une croissance substantielle de ses clients de large bande fixe (24,7%) et de fibre (58,5%). Ce succès dans l’expansion des services Internet haut débit présage bien pour les futurs flux de revenus.

    Avancées Technologiques

    Lancement de la 5G : L’introduction des services 5G au Sénégal marque une étape importante pour Sonatel. Cela positionne l’entreprise à l’avant-garde de l’innovation en télécommunications, offrant le potentiel de nouveaux flux de revenus à la fois pour les segments grand public et entreprise.

    Forts Indicateurs Opérationnels

    Abonnés Orange Money : Sonatel a rapporté une augmentation de 17,8% des abonnés Orange Money, soulignant la croissance des services financiers mobiles. Ce secteur est lucratif avec un fort potentiel de croissance, offrant une base de revenus diversifiée.

    Investissements Stratégiques

    eCAPEX : L’augmentation des investissements dans l’infrastructure, avec une hausse de 15,8% de l’eCAPEX, témoigne de l’engagement de Sonatel à étendre et à améliorer ses capacités réseau. Cela assure une croissance et une compétitivité à long terme sur le marché.

    Position sur le Marché et Environnement Réglementaire

    Leadership en Mobile Money : Les efforts pour retrouver le leadership d’Orange Money au Sénégal soulignent la forte présence de Sonatel sur le marché et son focus stratégique. Cette domination est cruciale pour une croissance et une rentabilité durables.

    Ajustements Réglementaires : La réduction de la taxe sur les données de 5% à 3% au Sénégal constitue un changement réglementaire positif. Cette ajustement devrait améliorer la rentabilité et la dynamique du marché, rendant le secteur des télécommunications plus attractif pour les investisseurs.

    Résilience Face aux Défis

    Adaptation aux Conditions du Marché : Malgré une crise énergétique et des restrictions Internet, Sonatel a fait preuve de résilience et de croissance continue. Cela démontre la capacité de l’industrie des télécommunications à s’adapter et à prospérer dans des environnements difficiles.

    Expansion Régionale et Stabilité

    Expansion du Marché : La présence de Sonatel dans plusieurs pays d’Afrique de l’Ouest offre une base de revenus diversifiée, réduisant la dépendance à un seul marché. Cette diversification régionale renforce la stabilité et les perspectives de croissance.

    Stabilité Politique et Économique : Les transitions démocratiques et la stabilité politique dans des marchés clés comme le Sénégal réduisent les risques géopolitiques, faisant du secteur des télécommunications une option d’investissement plus sûre.

    Conclusion

    La performance de Sonatel au Q1 2024 illustre l’immense potentiel de l’industrie des télécommunications. Avec une forte croissance financière, une base clientèle en expansion, des avancées technologiques, des investissements stratégiques, des changements réglementaires positifs, une résilience et une diversification régionale, le secteur des télécommunications présente une opportunité d’investissement convaincante.

    Pour les investisseurs cherchant à tirer parti d’une industrie dynamique et en croissance à travers le marché boursier, c’est le moment de considérer les télécommunications et Daba offre la bonne plateforme pour accéder à cette opportunité.

  • Investing in Telecom Industry: Insights from Sonatel Q1 2024 Report

    Investing in Telecom Industry: Insights from Sonatel Q1 2024 Report

    The telecom industry in francophone West Africa is rapidly evolving, presenting numerous opportunities for investors.

    With its shares listed on the regional BRVM exchange, Sonatel Group’s Q1 2024 (January to March) financial report highlights several compelling reasons this sector is worth considering.

    Here’s a detailed look at the key positives that make investing in the telecom industry a smart move.

    Strong Financial Growth

    Revenue Growth: Sonatel reported a 10.6% increase in revenues, reflecting a robust demand for telecom services. This indicates a healthy market and strong customer acquisition strategies.

    EBITDA Growth: The company’s EBITDA rose by 16.7%, showcasing improved profitability and operational efficiency. This clearly indicates that Sonatel is effectively managing its costs while enhancing its revenue streams.

    Net Result Improvement: With a 22.1% increase in net results, Sonatel demonstrates strong bottom-line growth. This improvement highlights the company’s ability to optimize revenues and control expenses.

    Expanding Customer Base

    Mobile Customers: Sonatel’s mobile customer base grew to 40.7 million, an increase of 6.2% year-over-year. This growth underscores the rising demand for mobile services and the company’s effective market penetration.

    4G Users: There was a significant 29.9% increase in 4G active users, reflecting the successful adoption of advanced mobile technologies. This positions Sonatel as a leader in providing high-speed mobile internet services.

    Fixed Broadband and Fiber: Sonatel saw substantial growth in its fixed broadband (24.7%) and fiber customers (58.5%). This success in expanding high-speed internet services bodes well for future revenue streams.

    Technological Advancements

    5G Launch: The introduction of 5G services in Senegal marks a significant milestone for Sonatel. This positions the company at the forefront of telecom innovation, offering the potential for new revenue streams from both consumer and enterprise segments.

    Strong Operational Metrics

    Orange Money Subscribers: Sonatel reported a 17.8% increase in Orange Money subscribers, highlighting the growth of mobile financial services. This sector is lucrative with high growth potential, providing a diversified revenue base.

    Strategic Investments

    eCAPEX: Increased investment in infrastructure, with eCAPEX up by 15.8%, indicates Sonatel’s commitment to expanding and upgrading its network capabilities. This ensures long-term growth and competitiveness in the market.

    Also Read: How to Pick a Stock: A Guide For Beginners

    Market Position and Regulatory Environment

    Leadership in Mobile Money: Efforts to reclaim leadership in Orange Money in Senegal underscore Sonatel’s strong market presence and strategic focus. This dominance is crucial for sustained growth and profitability.

    Regulatory Adjustments: The reduction in data tax from 5% to 3% in Senegal is a positive regulatory change. This adjustment is likely to improve profitability and market dynamics, making the telecom sector more attractive to investors.

    Resilience Amid Challenges

    Adaptation to Market Conditions: Despite facing an energy crisis and internet restrictions, Sonatel demonstrated resilience and continued growth. This showcases the telecom industry’s ability to adapt and thrive in challenging environments.

    Regional Expansion and Stability

    Market Expansion: Sonatel’s presence in multiple West African countries provides a diversified revenue base, reducing dependency on a single market. This regional diversification enhances stability and growth prospects.

    Political and Economic Stability: Democratic transitions and political stability in key markets like Senegal reduce geopolitical risks, making the telecom sector a safer investment option.

    Conclusion

    Sonatel’s Q1 2024 performance illustrates the immense potential of the telecom industry. With strong financial growth, an expanding customer base, technological advancements, strategic investments, positive regulatory changes, resilience, and regional diversification, the telecom sector presents a compelling investment opportunity.

    For investors looking to capitalize on a dynamic and growing industry through the stock market, now is the time to consider telecom and Daba offers the right platform to access this opportunity.

  • Qu’est-ce Qu’un Indice ? Un Guide Débutant des Marchés Boursiers

    Qu’est-ce Qu’un Indice ? Un Guide Débutant des Marchés Boursiers

    Les indices sont des concepts parmi les plus courants et les plus importants dans le monde de la finance et de l’investissement. Mais que signifient-ils exactement ?

    Un indice est un moyen de mesurer et de suivre la performance d’un groupe d’actions ou d’autres actifs. C’est comme un thermomètre pour le marché, montrant comment certaines parties du marché se comportent. En examinant un indice, les investisseurs peuvent voir si leurs investissements croissent, stagnent ou diminuent.

    Sur la BRVM (Bourse Régionale des Valeurs Mobilières), qui est la bourse régionale des huit pays d’Afrique de l’Ouest partageant le franc CFA comme monnaie, plusieurs indices suivent différents secteurs et aspects du marché.

    Exemples d’Indices sur la BRVM

    1. BRVM 30 : Cet indice suit les 30 actions les plus échangées sur la BRVM. C’est un bon indicateur de la performance globale du marché.
    2. BRVM Composite : Cet indice inclut toutes les actions cotées sur la BRVM, offrant une vue d’ensemble de la performance du marché.
    3. BRVM Prestige : Cet indice suit la performance des entreprises les plus prestigieuses cotées sur la BRVM.
    4. BRVM Principal : Cet indice suit les actions les plus importantes du marché principal, offrant des aperçus sur les principales entreprises.
    5. BRVM Agriculture : Cet indice suit les entreprises impliquées dans l’agriculture. Il est utile pour les investisseurs intéressés par le secteur agricole.
    6. BRVM Distribution : Cet indice se concentre sur les entreprises du secteur de la distribution, telles que le commerce de détail et de gros.
    7. BRVM Finance : Cet indice suit la performance des institutions financières comme les banques et les compagnies d’assurance.
    8. BRVM Industries : Cet indice couvre les entreprises industrielles, donnant une vue des secteurs de la fabrication et de la production.
    9. BRVM Autres Secteurs : Cet indice inclut des entreprises qui ne correspondent pas aux autres indices sectoriels spécifiques.
    10. BRVM Services Publics : Cet indice suit les entreprises qui fournissent des services publics, comme les services publics et les transports.
    11. BRVM Transport : Cet indice se concentre sur les entreprises impliquées dans le transport, y compris la navigation et la logistique.

    Daba offre un accès à diverses options d’investissement, y compris des actions et des fonds, reflétant les segments du marché suivis par des indices comme le BRVM Composite. Téléchargez notre application pour démarrer votre parcours d’investissement.

    Types d’Indices de Marché

    Les indices de marché utilisent diverses méthodes pour calculer leurs valeurs, souvent basées sur des moyennes pondérées. Cela signifie que la valeur de l’indice est dérivée d’une moyenne pondérée de toutes les actions individuelles qu’il contient.

    Méthodes de Calcul

    1. Indices Pondérés par le Prix : Dans ces indices, les actions avec des prix plus élevés ont un impact plus important sur la valeur de l’indice. Les changements dans les actions à prix élevé affectent significativement l’indice.
    2. Indices Pondérés par la Capitalisation Boursière : Ici, les actions avec de plus grandes capitalisations boursières ont plus d’influence. Les changements dans les plus grandes entreprises impactent significativement la valeur de l’indice.

    Indices Spécialisés

    D’autres indices se concentrent sur des secteurs ou des régions spécifiques, offrant une perspective de marché plus ciblée. Par exemple :

    1. Indices Sectoriels : Ils suivent des secteurs particuliers comme la technologie, la santé ou la finance.
    2. Indices Géographiques : Ils suivent des actions de régions spécifiques, comme les marchés émergents ou les actions européennes. Un exemple est le FTSE 100, qui suit les 100 plus grandes entreprises de la Bourse de Londres.

    Caractéristiques d’un Indice

    1. Outil de Mesure : Un indice mesure la performance des prix d’un groupe d’actions ou de titres.
    2. Point de Référence : Il sert de référence pour comparer la performance des fonds communs de placement, des gestionnaires de portefeuille et d’autres investissements.
    3. Option d’Investissement : Les investisseurs peuvent acheter des fonds indiciels ou des ETF qui suivent un indice, leur permettant d’investir dans un marché large ou un secteur spécifique avec un seul investissement.
    4. Représentation du Marché : Les indices peuvent représenter l’ensemble du marché (large) ou des secteurs spécifiques (sectoriels).

    Pourquoi les Indices Sont-Ils Importants ?

    Les indices sont essentiels pour plusieurs raisons :

    1. Suivi des Données Financières : Ils aident à suivre les données financières comme les rendements boursiers, les taux d’intérêt et l’inflation.
    2. Investissement Passif : Les indices permettent l’investissement passif à travers des fonds indiciels et des ETF, qui sont des moyens peu coûteux d’investir dans le marché.
    3. Indicateurs Économiques : Des indices comme le CPI (Consumer Price Index) et le PMI (Purchasing Managers’ Index) sont utilisés pour mesurer l’activité économique et l’inflation.
    4. Portefeuilles Diversifiés : Les investisseurs peuvent construire des portefeuilles incluant un mélange de différents indices pour obtenir une exposition large au marché.
    5. Comparaison de Référence : Les investisseurs comparent la performance de leurs portefeuilles aux indices pour évaluer leur succès. Par exemple, un fonds commun de placement pourrait être comparé au S&P 500 pour voir comment il se comporte par rapport au marché.
    6. Allocation de Segment : Certains investisseurs allouent des fonds en fonction des rendements attendus de segments spécifiques du marché, utilisant des indices pertinents pour guider leurs décisions.

    Avec la plateforme transparente et conviviale de Daba, les investisseurs peuvent facilement suivre la performance de leurs investissements, comme le suivi des mouvements d’un indice pour une prise de décision éclairée. Téléchargez notre application pour commencer.

    Les Bases de l’Investissement Indiciel

    L’investissement indiciel consiste à investir dans un portefeuille conçu pour correspondre ou suivre les composants d’un indice de marché. Voici comment cela fonctionne :

    1. Investissement à Faible Coût : Les fonds indiciels et les ETF ont généralement des frais plus bas que les fonds gérés activement.
    2. Diversification : Investir dans un indice offre une exposition large au marché, réduisant le risque associé aux actions individuelles.
    3. Rendements Constants : Les fonds indiciels visent à répliquer la performance d’un indice, offrant des rendements stables dans le temps.
    4. Facilité d’Investissement : C’est plus facile pour les investisseurs qui n’ont pas le temps ou l’expertise pour sélectionner des actions individuelles.

    Avantages de l’Investissement Indiciel

    1. Frais Réduits : Les fonds indiciels ont des frais de gestion inférieurs par rapport aux fonds gérés activement.
    2. Risque Réduit : En investissant dans une large gamme d’actions, les fonds indiciels répartissent le risque.
    3. Performance Constante : De nombreux fonds gérés activement sous-performent par rapport à leurs indices de référence sur le long terme. Les fonds indiciels offrent souvent de meilleurs rendements avec moins de risques.
    4. Simplicité : L’investissement indiciel est simple et ne nécessite pas de négociation fréquente ou d’analyse approfondie des actions individuelles.

    Pourquoi l’Investissement Indiciel Peut Vous Convenir

    1. Gain de Temps : L’investissement indiciel est une excellente option si vous n’avez pas le temps ou l’expertise pour choisir des actions individuelles.
    2. Rentable : Avec des frais inférieurs à ceux des fonds gérés activement, les fonds indiciels gardent plus de votre argent en activité pour vous.
    3. Performance du Marché : Les fonds indiciels surperforment souvent de nombreux fonds gérés activement sur le long terme.
    4. Exposition Diversifiée : Investir dans un indice vous expose à une large gamme d’actions, réduisant l’impact de la mauvaise performance d’une seule action.

    Les indices sont essentiels pour suivre la performance du marché, investir de manière passive et comparer les rendements.

    La BRVM offre divers indices qui fournissent des aperçus sur différents secteurs et le marché global, aidant les investisseurs à prendre des décisions éclairées. Que vous regardiez le BRVM 30 pour un aperçu des principales actions ou des indices sectoriels spécifiques comme le BRVM Agriculture, il existe une richesse d’informations pour guider vos investissements. L’investissement indiciel peut être une stratégie intelligente pour ceux qui recherchent une exposition large au marché avec moins de risques et de coûts.

    Les investisseurs peuvent tirer parti de la plateforme de Daba pour explorer les marchés émergents comme ceux représentés sur la BRVM, diversifiant ainsi leurs portefeuilles pour une croissance à long terme. Téléchargez notre application maintenant ou cliquez ici pour en savoir plus.

  • What is an Index? A Beginner Guide to Stock Markets

    What is an Index? A Beginner Guide to Stock Markets

    Indexes are some of the most common and important concepts in the world of finance and investing. But what do they mean?

    An index is a way to measure and track the performance of a group of stocks or other assets. It’s like a thermometer for the market, showing how well certain parts of the market are doing. 

    By looking at an index, investors can see if their investments are growing, staying the same, or shrinking.

    On the BRVM—the Bourse Régionale des Valeurs Mobilières, which is the regional stock exchange for the eight West African countries that share the CFA franc as their currency—several indexes track different sectors and aspects of the market.

    Examples of Indexes on the BRVM

    1. BRVM 30: This index tracks the 30 most traded stocks on the BRVM. It’s a good indicator of the overall market performance.

    2. BRVM Composite: This index includes all the stocks listed on the BRVM. It provides a broad view of the entire market’s performance.

    3. BRVM Prestige: This index tracks the performance of the most prestigious companies listed on the BRVM.

    4. BRVM Principal: This index follows the main market’s most significant stocks, offering insights into the leading companies.

    5. BRVM Agriculture: This index tracks companies involved in agriculture. It’s useful for investors interested in the agricultural sector.

    6. BRVM Distribution: This index focuses on companies in the distribution sector, such as retail and wholesale businesses.

    7. BRVM Finance: This index tracks the performance of financial institutions like banks and insurance companies.

    8. BRVM Industries: This index covers industrial companies, giving a view of the manufacturing and production sectors.

    9. BRVM Other Sectors: This index includes companies that don’t fit into the other specific sector indexes.

    10. BRVM Public Services: This index tracks companies that provide public services, like utilities and transportation.

    11. BRVM Transport: This index focuses on companies involved in transportation, including shipping and logistics.

    Daba offers access to diverse investment options, including stocks and funds, mirroring the market segments tracked by indexes like the BRVM Composite. Get our app here to kick off your investing journey.

    Types of Market Indexes

    Market indexes use various methods to calculate their values, often based on weighted averages. This means the value of the index is derived from a weighted average of all the individual stocks within it.

    Calculation Methods

    1. Price-Weighted Indexes: In these indexes, stocks with higher prices have a greater impact on the index’s value. Changes in high-priced stocks significantly affect the index.

    2. Market Capitalization-Weighted Indexes: Here, stocks with larger market capitalizations have more influence. Changes in the largest companies will significantly impact the index’s value.

    Specialized Indexes

    Other indexes focus on specific sectors or regions, offering a more targeted market perspective. For example:

    1. Sector-Specific Indexes: These track particular sectors like technology, healthcare, or finance.

    2. Geographic Indexes: These track stocks from specific regions, such as emerging markets or European stocks. An example is the FTSE 100, which tracks the 100 largest companies on the London Stock Exchange.

    Features of an Index

    1. Measurement Tool: An index measures the price performance of a group of stocks or securities.

    2. Benchmark: It serves as a benchmark for comparing the performance of mutual funds, portfolio managers, and other investments.

    3. Investment Option: Investors can buy index funds or ETFs that track an index, allowing them to invest in a broad market or specific sector with a single investment.

    4. Market Representation: Indexes can represent the entire market (broad-based) or specific sectors (sectoral).

    Why Indexes Are Important

    Indexes are essential for several reasons:

    1. Tracking Financial Data: They help track financial data like stock market returns, interest rates, and inflation.

    2. Passive Investing: Indexes enable passive investing through index funds and ETFs, which are low-cost ways to invest in the market.

    3. Economic Indicators: Indexes like CPI (Consumer Price Index) and PMI (Purchasing Managers’ Index) are used to measure economic activity and inflation.

    4. Diversified Portfolios: Investors may build portfolios that include a mix of different indexes to achieve broad market exposure.

    5. Benchmark Comparison: Investors compare their portfolios’ performance against indexes to gauge success. For example, a mutual fund might be benchmarked against the S&P 500 to see how well it performs relative to the market.

    6. Segment Allocation: Some investors allocate funds based on the expected returns of specific market segments, using relevant indexes to guide their decisions.

    With Daba’s transparent and user-friendly platform, investors can easily track the performance of their investments, akin to monitoring index movements for informed decision-making. Tap here to get started.

    Basics of Index Investing

    Index investing involves investing in a portfolio designed to match or track the components of a market index. Here’s how it works:

    1. Low-Cost Investment: Index funds and ETFs generally have lower fees than actively managed funds.

    2. Diversification: Investing in an index provides broad market exposure, reducing the risk associated with individual stocks.

    3. Consistent Returns: Index funds aim to replicate the performance of an index, offering stable returns over time.

    4. Ease of Investment: It’s easier for investors who don’t have the time or expertise to select individual stocks.

    Benefits of Index Investing

    1. Lower Fees: Index funds have lower management fees compared to actively managed funds.

    2. Reduced Risk: By investing in a wide range of stocks, index funds spread out the risk.

    3. Consistent Performance: Many actively managed funds underperform their benchmark indexes over the long term. Index funds often provide better returns with less risk.

    4. Simplicity: Index investing is straightforward and doesn’t require frequent trading or in-depth analysis of individual stocks.

    Why Index Investing Might Be Right for You

    1. Time-saving: Index investing is a great option if you need more time or expertise to pick individual stocks.

    2. Cost-Effective: With lower fees than actively managed funds, index funds keep more of your money working for you.

    3. Market Performance: Index funds often outperform many actively managed funds over time.

    4. Diversified Exposure: Investing in an index exposes you to a wide range of stocks, reducing the impact of any single stock’s poor performance.

    Indexes are essential for tracking market performance, investing passively, and benchmarking returns.

    The BRVM offers various indexes that provide insights into different sectors and the overall market, helping investors make informed decisions. 

    Whether you’re looking at the BRVM 30 for a snapshot of the top stocks or sector-specific indexes like BRVM Agriculture, there’s a wealth of information to guide your investments. Index investing can be a smart strategy for those seeking broad market exposure with lower risk and cost.

    Investors can leverage Daba’s platform to explore emerging markets like those represented on the BRVM, diversifying their portfolios for long-term growth. Download our app now or tap here to learn more.

  • South African Small-Cap Industrials Offer Investors a Unique Opportunity

    South African Small-Cap Industrials Offer Investors a Unique Opportunity

    Contributed by Chipo Muwowo, Founder of Capital Markets Africa.


    • SA small-cap Industrials enjoy strong earnings potential
    • Some firms have completed judicious acquisitions in recent years
    • Stock prices remain attractive despite significant increases in their value

    African equity markets offer investors great promise. This is even though most African listed companies don’t appear on leading, global frontier and emerging market indices.

    On the Johannesburg Stock Exchange (JSE), Africa’s largest and most liquid stock exchange, one sector that deserves more attention from investors is the small-cap industrials sector.

    In this short piece, we highlight three stocks that could provide investors with a route into South African equities, perhaps for the first time. 

    Why?

    SA industrials enjoy strong earnings potential driven by diversification and good asset management. Some firms have completed judicious acquisitions at home and abroad in recent years, and stock prices remain attractive despite significant increases in their value.

    Afrimat Limited (JSE: AFT)

    Afrimat is a mining and materials company listed on the Johannesburg Stock Exchange. 

    The company supplies a broad range of products: construction materials such as aggregates, bricks, and ready mix concrete; industrial minerals such as lime and lime products; bulk commodities such as iron ore and anthracite; future materials & metals such as phosphate, vermiculite, rare earth,s and green construction materials.

    In addition, Afrimat Mining Services offers full pit-to-port solutions to the mining, construction, and quarry industries throughout Southern Africa.

    Last year, the company generated revenues of ZAR2.8 billion (about $150 million), and operating profit was up 18.8%. CAGR Diluted EPS for the previous five years is up 21.47%.

    Last month, Afrimat had its bid to acquire the South African operations of Lafarge, the global cement manufacturer, approved by the Competition Tribunal. 

    Afrimat CEO Andries van Heerden said of the deal, “It will increase [our] offering in the construction materials space, by expanding the Group’s quarry and ready-mix operations nationally. Additionally, access to the fly ash operations provides a foothold into the cement extender market. The grinding plant will allow Afrimat to grind various materials as value-added products for our current and new customers. In contrast, the cement kilns allow the Group to enter the cement value chain competitively.”

    Hudaco Industries Limited (JSE: HDC)

    Hudaco specializes in the importation and distribution of a broad range of high-quality, branded automotive, industrial, and electronic consumable products (mainly on an exclusive basis) for the South African and wider Southern African region.

    It primarily supplies the consumer markets with stand-by and solar batteries, cooking and heating products, automotive spares and accessories, and more. Under engineering consumables, it supplies diesel engines, hydraulic and pneumatic equipment, electrical cable accessories, and more.


    Over the years, the firm has been acquisitive. Last year, it bought the businesses of Brigit Fire (“to invest in an industry with growth potential and to further diversify the revenue stream”) as well as Plasti-Weld (“as a bolt-on acquisition for Astore Keymak, our thermoplastic pipes and fittings business”).

    Last year, the company generated revenues of ZAR2.46 billion (about $132 million), and operating profit was up 23%. CAGR Diluted EPS for the previous five years is up 26.27%.

    This was despite significant macroeconomic challenges – “chaos at South African ports impacting the supply chain, the impact of unprecedented levels of load-shedding, and rand volatility and weakness increasing cost of inventory,” its annual report noted.

    Argent Industrial Limited (JSE: ART)

    The group sells and trades manufactured steel and steel-related products such as metal gates, railings, and shutters. It owns over 20 vertically integrated subsidiaries in South Africa, the UK, and the US while it sends exports to over 35 countries globally. The Argent group of companies also includes several jet refueling and fuel storage businesses.

    In 2021, it acquired South Africa-based American Shutters, a supplier of “a stylish door and window shutter security system” for ZAR57 million. A year earlier, it acquired UK-based Partington Engineering, a supplier of bespoke trolleys for both the traditional and e-commerce retail sectors, for GBP3.1 million.

    Last year, the company generated revenues of ZAR2.46 billion (about $132 million), and operating profit was up 23%. CAGR Diluted EPS for the previous five years is up 26.27%.

    In a note to investors last year, Rudi van Niekerk of fund manager Desert Lion Capital said, “I strongly believe that the market has been wrong on this one for a while now. Argent is not a hot AI stock. Maybe that is one of the reasons it is ignored by the market. Yet, as a real-world- economy stock, Argent’s earnings growth would make many a tech stock blush.”